Before we start, I will say that the following post is using only the data from Peoria as I haven't learned to correct for park differences. Also, I did not break up the fastballs between two- and four-seam fastballs. I feel that the change-up's were all labeled correctly -- except one, which I believe was a breaking ball. Speaking of the breaking ball, I've elected to go with labeling them as a Slider. Whether it's a slider or a curveball ... I don't know. I'm not sure it matters so long as the labeling is consistent.
Now, on with the PITCHf/x graphy goodness after the jump
First up, we'll run with the average release points plot for Weinhardt (all graphs are from the catcher's view; click all images to enlarge):
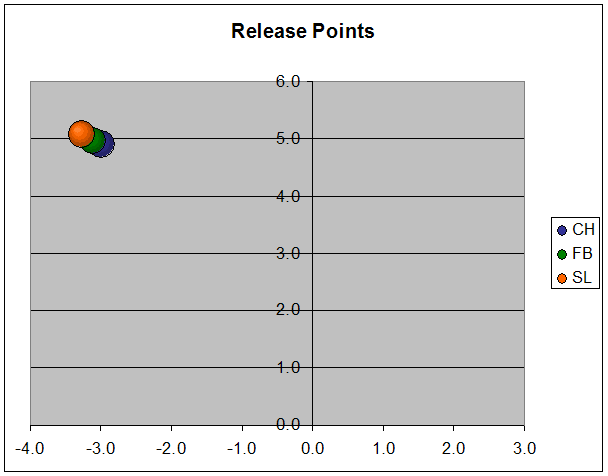
Here, we see that Weinhardt is coming from a low-three-quarter angle. He's "releasing" the baseball at around the 5-foot mark off the ground. You can tell it's a three-quarter delivery because it's pretty far out on the left hand side of the graph. most release point graphs are -3, 3 on the X-axis and he's out beyond that by a couple of inches. He is listed at being 6-foot-2 and 205-pounds, so he's not dropping down a ton, but it's still a low three-quarter arm slot.
Now, here's the total release points for Weinhardt:
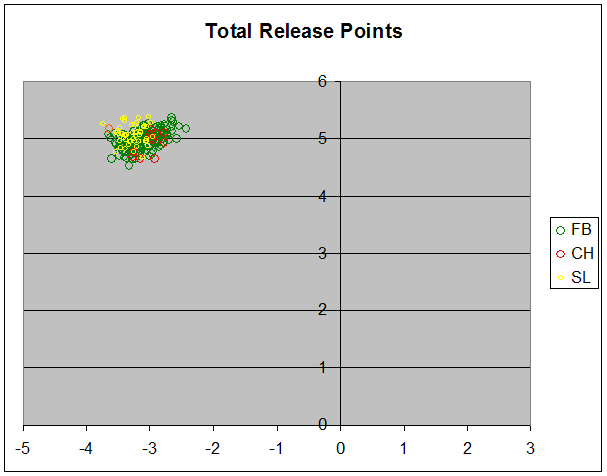
I had to change the colors slightly to try to make it all viewable. However, you can see the amount of fastballs he threw compared to the rest of his arsenal.
Here is the strikezone plot:

He really seemed to pound the zone pretty consistently. He liked to work the left side of the plate, which is inside to right-handed hitters.

I didn't change the gameday labels for his change-up because I thought all (except one, as I noted earlier) were properly labeled. I may be wrong on this. However, he only threw 11 of them total and all of them were to left-handers. Overall he was throwing the gas three-quarters of the time. The numbers inside each graph is the actual total of each pitch type thrown.
Finally, the pitch flight graphs:

Let's hit each of his pitches separately:
Fastball (green line): It came in at 93 MPH and has some very nice arm-side run which is due to his low-three quarter delivery. It doesn't have a lot of sink but the velocity and arm-side run should be more than enough to get outs on the ground and generate a fair amount of whiffs. There is a lot to like here.
Slider (orange line): He only threw 51 of these and they clocked in at 83 MPH. It's got nice separation from the heater in terms of velocity and in movement. It's a bit of a sweeper, moving across the plate from the right hand batters box towards the left hand batters box. It's got some good downward action to it as well and, assuming it gets located well, is a definitely strikeout pitch. The problem with making hard conclusions on this is that if you refer back to the strikezone plot, you will see plenty of sliders hung up and in to right-handed batters (top left portion of the graph). because of the fact that there are only 51 recorded, any number of poorly thrown sliders will drastically alter the pitch flight paths as these are average pitch flights. His slider probably breaks downward more than it actually seems to be right here.
Change-up (blue line): Came in, on average, just a shade under 85 MPH. Pretty decent separation in velocity but the bread-and-butter of this is the amount of arm-side run and sinking action he gets. Weinhardt's still inconsistent with the change but it has wonderful potential. However, this is just an 11 pitch sample so all expectations and praise should be held off a bit. If it is at all indicative of the things he can do with the pitch, he's got a bright future in the back of the Tigers bullpen as soon as 2010.
Caveats
As always, this is a small sample and the PITCHf/x system is not infallible -- especially given that this is the first year the system has been implemented in the Arizona Fall League. However, it's still able to give some good insight into what Robbie Weinhardt can do.
During the 2008 draft, I was doing some research into adjusting college baseball statistics. I wound up focusing much more on hitters (which you can read about here, though my methods and formula's have been tweaked since the publication of that article). I did dabble in adjusting college pitching statistics but soon found it to be a tough task given scouting a pitchers mechanics is the largest part of evaluating amateur pitchers. But, in the work that I did do, I liked Robbie Weinhardt much more than fellow 2008 college reliever draftee Ryan Perry. Why?
I think Weinhardt has better control and command (though he's still plenty erratic in his own right -- if he wasn't, he'd be a starting pitcher). Also, he was just as dominant in college. And though he doesn't throw as hard as Perry, he'll likely be just as effective. Velocity isn't everything (Joel Zumaya, anyone?) and looking at the pitch flight graph here really makes me excited for the future of Weinhardt and has done virtually nothing to sway me of my opinion.


No comments:
Post a Comment