We've got our shortstop. Adam Everett has returned for the paltry price of $1.55 million. He apparently was looking in the $3 million range, but signs for half of that. Do we get our money's worth?
Basically, if he repeats his 2009 season, we easily get about 4 times the surplus value of Everett. But, I'm going to say this: he needs to play more.
I know, I know, his bat is awful. It's a pain to watch him stink it up at the plate at the bottom of the order. But that's not where his money lies. Valuing Adam Everett occurs at the jump. . .
Showing posts with label WAR. Show all posts
Showing posts with label WAR. Show all posts
Monday, December 7, 2009


Sunday, November 15, 2009
Trading Curtis Granderson
The media and internet has been quite a-buzz with rumors of Curtis Granderson potentially being shopped by the Detroit Tigers. I want to say this right off the bat: I think Dombrowski is listening to offers, not shopping him. There's a difference between the two. And I see no reason for Dombrowski to not listen. You don't know if someone's willing to trade you the moon for him if you're not open to the discussion.
I've valued Curtis Granderson to be quite the bargain back when Lynn Henning was hitting him with the "Trade This Tiger" dart-toss of a column. He finished the 2009 season with 3.4 Wins Above Replacement and now with the Bill James and CHONE projections (hitters only, thus far) being released, we can get a pretty good read on his value. In the past, the Bill James projections have been a bit inflated (probably has to do with the level at which he is regressing the past numbers) and CHONE has proven to be a beast of a projection system as of late. Let's examine him (again). . .
I've valued Curtis Granderson to be quite the bargain back when Lynn Henning was hitting him with the "Trade This Tiger" dart-toss of a column. He finished the 2009 season with 3.4 Wins Above Replacement and now with the Bill James and CHONE projections (hitters only, thus far) being released, we can get a pretty good read on his value. In the past, the Bill James projections have been a bit inflated (probably has to do with the level at which he is regressing the past numbers) and CHONE has proven to be a beast of a projection system as of late. Let's examine him (again). . .
Wednesday, October 14, 2009
Anatomy of a Player: Miguel Cabrera
Update: I had to change some of the graphs as I had the data in the wrong chronological order. It should be fixed now.
I had stared a series I was going to call Graphic Value but I've decided to change the way I'm going to attack breaking down the Tigers. I'm going to start on an individual basis in something I'm tentatively calling Anatomy of a Player and you will be able to find the series in the sidebar to the right.
My first player will be Miguel Cabrera. I was going to start with catchers, but I don't have multiple-year catcher defensive data at the ready, so I can't go with Gerald Laird.
Below the jump you'll find graphs galore. I'm trying to make the value each player has more visual. However, I'm stuck with Excel 2003 (yeah, I know.) and until I upgrade and check out different graphing features, the only way that seemed right to me was a lot of stacked bar graphs. You'll see what I mean as I show where Miguel Cabrera's value comes from and how much value he has over the average (and replacement-level) player at his positions over the last four seasons after the jump. . .
Friday, October 9, 2009
Exploring Milton Bradley's Potential
Over at MLive, Patrick Hayes has his thoughts on how the Tigers should be fixed. It's a lot of stuff that I plan to be covering in the future (tentative plans, I should say) but here's his Right Field solution:
Quick thought without doing any math on it: I like the deal and if it's on the table, Detroit should take it and run.
Now, let's do some back-of-the-envelope math after the jump . . .
Right Field: The outfield needs a makeover, and it's going to start here. Trade Jeremy Bonderman to the Cubs for Milton Bradley. Both make roughly $10 million per year. Bradley is signed for one more year than Bonderman, but the Cubs are desperate to get rid of him, so it's conceivable they'd pay that final year if the Tigers take him.It's interesting and outside the box, for sure. I know the Cubs are anxious to get rid of the PR Nightmare that has been the I-won't-bite-my-tongue and contract that comes with Bradley, but I'm not sure they'll deal for another terrible contract of a guy who can't stay healthy and is making minor improvements.
Jim Leyland is known for working well with head cases. Gary Sheffield didn't produce in Detroit, but he didn't make waves either. So what you say? Well, in NY he was calling Derek Jeter "not all the way black" and Joe Torre a slave master. He's had nothing negative to say about his Detroit tenure. Bradley is not as crazy as Sheff, this can work.
Before signing with the Cubs, Bradley had a career-year in Texas, with a .999 OPS. Once he escapes the racism in Wrigleyville and comes to the more laid back environment in Detroit, he'll be just fine.
And for those who think Bonderman's still young and can bounce back? You might be right. But it's time to get some of the Seay/Lyon/Bonderman radio-controlled car driving crowd out of here, you know? The Starter: Milton Bradley
Quick thought without doing any math on it: I like the deal and if it's on the table, Detroit should take it and run.
Now, let's do some back-of-the-envelope math after the jump . . .
Tuesday, September 29, 2009
Best of the Best: Defensive Single Seasons in Tigers History
I'm currently engrossed in learning how to use MySQL, a database program, which will help me do some great lists of the best _____ in Tigers history. Whenever I get it figured out and the code working, I'll be creating a series of the ten best Catcher's in Tigers history, ten best first basemen in Tigers history and so on and so forth. Those will all be in the side bar to the right, just below the 'about me' in a section called Best of the Best.
In lieu of that, however, I bring you a different list that didn't take any database code.
Sean Smith's released Wins Above Replacement numbers for every player in the major leagues since 1871. You can peruse them at his site and, if you like 'em, support him by donating $25 to use them however you'd like. I did that and got the hitters and pitchers files. That is what I'll be using to look back into plunge into Detroit Tigers history. What I'll be focusing on here, is defense.
Sean Smith has created TotalZone which he uses to judge defense through play-by-play box scores from Retrosheet. You can read his methods here.
So this begs the question: Who had the greatest defensive season in the history of the Detroit Tigers? Find out the answer after the jump...
Monday, September 21, 2009
Position Player Value Breakdown
Inspired by these cool graphs, I've taken to a less-asthetically-pleasing graph of value breakdown. I don't have a cool graphing program, so these are just Excel graphs. I also couldn't decide which I liked better -- horizontal or vertical bar graphs -- so I've got them both, for your view pleasure.


Click on both images to enlarge.
What these graphs show is, obviously, how each player I've looked at arrive at their cumulative value. I didn't include "Replacement" runs which turns "Runs Above Average" into "Runs Above Replacement" and then, when you divide by 10, you get "Wins Above Replacement."
Predictably, Miguel Cabrera's value lies in his immense talents at the plate. But what I find most interesting from these graphs, is the way it depicts the "invisible" value that players have -- defense and position.
Taking Gerald Laird, for example, I've included defense into his numbers. Fangraphs doesn't carry defensive estimations for Catchers because it's hard to figure out what to give to them. There have been some attempts, but I'm going off of this leader board put together over at Beyond the Boxscore on August 5th. For Laird, what I've done is taken his 16.12 runs above average in his first 711 innings and extrapolated it out over his 981 innings which gives him 22.4 runs above the average catcher. That is what I mean by "invisible" value. You know that Gerald Laird has been excellent in throwing out runners this year, but did you know that when you include passed balls and his reputation around the league are added in, his defense makes up about half of his total value?
Tigers fans have lamented the offense this year -- and for good reason -- but Gerald Laird brings much more to the table than his paltry batting line this year.
Quick hits about the graph(s):
-Miguel Cabrera's offense alone (40.2 runs) is more than anyone else's total value in these graphs (Laird, 32.1 and Granderson and Polanco are both at 31.2 total).
-Marcus Thames should probably be gone next year. He's only going to be more expensive and while his $2.275 million didn't break the bank this year, it's just money being wasted.
-Clete Thomas may have a long swing that leads to a lot of K's, but his defense this year has been unreal; +13.4 runs this year already.
Leave any questions you've got in the comments, I'll answer them. I also want all criticism on what would make these graphs better understood/look better.
Tuesday, September 15, 2009
Curtis Granderson's Trade Value
So there's been much scuttlebutt about trading Curtis Granderson. Ian's covered this once before and did so again today. Kurt covered it in-depth today as well. I'm sure Billfer and Lee will chime in with thoughts at some point. This all comes in relation to Lynn Henning writing his weekly "Detroit should trade _____" articles, and he picked Granderson to be the focal point. He's not new to this at all, writing before about trading Granderson and spending many written words about dealing Magglio Ordonez.
It begs the question: Should the Tigers trade Curtis Granderson?
I'm of the opinion that no one is off limits. The closest the Tigers have to an "untouchable" player is Miguel Cabrera followed by Curtis Granderson. But, no one is truly untouchable. Albert Pujols is not even untouchable. It'd just take a package that's too large and franchise-crippling to make a deal for him.
Everyone is down on Granderson this year due to his .248/.331/.457 line. He's also been beyond terrible against left-handed pitching, posting a paltry line of .169/.241/.234. That's awful. I'm not going to defend it. OK, maybe I will try. He's got a .211 BABIP this year against lefties. That's the lowest he's had against southpaws in his career. He had a .296 BABIP against lefties in 2006, .211 in 2007, and .292 in 2008.
What does that mean? He'll probably regress to the good in 2010 and post a more respectable, league-average line against left-handers.
Including 2009, his career BABIP against lefties is .254. So, he's currently 43-points below his career average BABIP against LHP. Let's normalize that up to .254 and assume that they're all just singles. This just adds on 3 more hits, but raises his split against LHP to a line of .188/.259/.253 for an OPS of .512. Still awful and well below the .258/.323/.411 average line for LHB vs. LHP's. The average BABIP for LHB's vs. LHP's in 2009 is .304. Just for fun, we'll normalize Granderson's line out to that league average BABIP for LHB's vs. LHP's. Doing so, we get this: .225/.292/.292 for an OPS of .584 -- again, awful.
What we know for sure is that he's absolutely terrible in 2009 against left-handers. He's also shown to be awful against southpaws in 2007. But, he was average or better in 2006 and 2008. So what do we believe his true talent is? Somewhere in the middle.
This is why the love affair with split stats -- even platoon splits -- are a dangerous game. The small samples lead to misleading results. He's closer to his career .617 OPS against LHP than he is to his terrible sub-.500 OPS this year.
That was a lot of words to basically try to warn of pinning a player's value on his platoon splits only. Because, he's facing about triple the amount of right-handers than left-handers (2146 PA's versus RHP and 659 versus LHP in his career). Remember how everyone, including me, was up on arms about Dusty Ryan not getting the chance to play and how he was better than his 29 PA sample this year showed? Well, Curtis Granderson only has 28% of his plate appearances against southpaws.
So what is Grandy's true value? How about a 3.2 Wins Above Replacement season this year? What was he last year when he was much better against lefties? 3.8 WAR. Granderson's appeared in 140 of 143 Tigers games this year -- 98%. Give him 98% for the final 19 games and we're predicting another 18-19 games played for Curtis. We'll give him 19. We can expect about 0.43 WAR in those 19 games. Add that to his 3.2 already accumulated and he's on pace for a 3.63 WAR season -- not far off from his "much better season" from last year.
His offense is down 15.8 runs from 2008, but his defense is up 10.2 runs over 2008. After all the math gets crunched out, he's pretty close to his value from 2008.
With that said, and in an attempt to wrap up this rambling piece, what is he worth? He's currently 28 and posted WAR's of 3.6 (I'm projecting that out) in 2009, 3.8 in 2008, and 7.4 in 2007. Weight that out and you get 4.42 WAR over the last three years. Let's use that going forward. I think that he'll age well given his body type and work ethic, so instead of knocking off 0.5 WAR the rest of his contract, I'll take off 0.25.
2010: 4.4
2011: 4.15
2012: 3.9
2013: 3.65
If we use Sky Kalkman's Trade Value Calculator, that would look like this:

What we see here is I've projected him for 16.1 WAR over the next four seasons. His 2013 season is an option and there's a $2 million buyout, which essentially cuts his salary from $13 mil down to $11 mil. The projection puts him at $79.1 million in performance value while he'll only be costing the Tigers $34.8 million and that gives the Tigers a surplus value of $44.3 million.
Essentially, he's underpaid, if this back-of-the-envelope methodology is accurate (which I'm not saying it is infallible) by $44 million.
Now, if we know 0.5 wins off each year for aging we get this:
2010: 4.4
2011: 3.9
2012: 3.4
2013: 2.9
What's that look like in value?
 Basically projecting 14.6 WAR which is worth $72.3 million in that time frame and will be a surplus value of $37.6 million.
In short: he's under paid and under valued. Even if we start him at 4 WAR next year rather than 4.4, you get the following value:
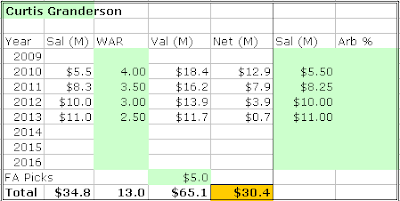 There's $30.4 million in surplus value.
Basically, Curtis Granderson's surplus value to the Detroit Tigers is too great to be traded. Here's a table of research done by Victor Wang.
To get fair value for Curtis Granderson in the three projections we would need to get back:
First projection of $79.1 million: 2 top-10 hitting prospects (as ranked by Baseball America; $73 million in value) and one Grade-B pitcher (graded by John Sickels; $7.3 million). Total package value of $80.3 million.
Second projection of $72.3 million: 2 top-10 hitting prospects ($73 million in value).
Third projection of $65.1 million: 1 top-10 hitting prospect ($36.5 million), 1 top-10 pitching prospect ($15.2 million) and a Grade-B pitcher ($7.3 million), one grade-B hitter ($5.5 million). Total package value of $64 million.
Here's Baseball America's top 100 prospect list from before the season if you'd care to gander at the top 10 hitting prospects or top 10 pitching prospects.
Basically, Granderson's not going anywhere. But there's no harm in fielding offers for him.
It begs the question: Should the Tigers trade Curtis Granderson?
I'm of the opinion that no one is off limits. The closest the Tigers have to an "untouchable" player is Miguel Cabrera followed by Curtis Granderson. But, no one is truly untouchable. Albert Pujols is not even untouchable. It'd just take a package that's too large and franchise-crippling to make a deal for him.
Everyone is down on Granderson this year due to his .248/.331/.457 line. He's also been beyond terrible against left-handed pitching, posting a paltry line of .169/.241/.234. That's awful. I'm not going to defend it. OK, maybe I will try. He's got a .211 BABIP this year against lefties. That's the lowest he's had against southpaws in his career. He had a .296 BABIP against lefties in 2006, .211 in 2007, and .292 in 2008.
What does that mean? He'll probably regress to the good in 2010 and post a more respectable, league-average line against left-handers.
Including 2009, his career BABIP against lefties is .254. So, he's currently 43-points below his career average BABIP against LHP. Let's normalize that up to .254 and assume that they're all just singles. This just adds on 3 more hits, but raises his split against LHP to a line of .188/.259/.253 for an OPS of .512. Still awful and well below the .258/.323/.411 average line for LHB vs. LHP's. The average BABIP for LHB's vs. LHP's in 2009 is .304. Just for fun, we'll normalize Granderson's line out to that league average BABIP for LHB's vs. LHP's. Doing so, we get this: .225/.292/.292 for an OPS of .584 -- again, awful.
What we know for sure is that he's absolutely terrible in 2009 against left-handers. He's also shown to be awful against southpaws in 2007. But, he was average or better in 2006 and 2008. So what do we believe his true talent is? Somewhere in the middle.
This is why the love affair with split stats -- even platoon splits -- are a dangerous game. The small samples lead to misleading results. He's closer to his career .617 OPS against LHP than he is to his terrible sub-.500 OPS this year.
That was a lot of words to basically try to warn of pinning a player's value on his platoon splits only. Because, he's facing about triple the amount of right-handers than left-handers (2146 PA's versus RHP and 659 versus LHP in his career). Remember how everyone, including me, was up on arms about Dusty Ryan not getting the chance to play and how he was better than his 29 PA sample this year showed? Well, Curtis Granderson only has 28% of his plate appearances against southpaws.
So what is Grandy's true value? How about a 3.2 Wins Above Replacement season this year? What was he last year when he was much better against lefties? 3.8 WAR. Granderson's appeared in 140 of 143 Tigers games this year -- 98%. Give him 98% for the final 19 games and we're predicting another 18-19 games played for Curtis. We'll give him 19. We can expect about 0.43 WAR in those 19 games. Add that to his 3.2 already accumulated and he's on pace for a 3.63 WAR season -- not far off from his "much better season" from last year.
His offense is down 15.8 runs from 2008, but his defense is up 10.2 runs over 2008. After all the math gets crunched out, he's pretty close to his value from 2008.
With that said, and in an attempt to wrap up this rambling piece, what is he worth? He's currently 28 and posted WAR's of 3.6 (I'm projecting that out) in 2009, 3.8 in 2008, and 7.4 in 2007. Weight that out and you get 4.42 WAR over the last three years. Let's use that going forward. I think that he'll age well given his body type and work ethic, so instead of knocking off 0.5 WAR the rest of his contract, I'll take off 0.25.
2010: 4.4
2011: 4.15
2012: 3.9
2013: 3.65
If we use Sky Kalkman's Trade Value Calculator, that would look like this:

What we see here is I've projected him for 16.1 WAR over the next four seasons. His 2013 season is an option and there's a $2 million buyout, which essentially cuts his salary from $13 mil down to $11 mil. The projection puts him at $79.1 million in performance value while he'll only be costing the Tigers $34.8 million and that gives the Tigers a surplus value of $44.3 million.
Essentially, he's underpaid, if this back-of-the-envelope methodology is accurate (which I'm not saying it is infallible) by $44 million.
Now, if we know 0.5 wins off each year for aging we get this:
2010: 4.4
2011: 3.9
2012: 3.4
2013: 2.9
What's that look like in value?
 Basically projecting 14.6 WAR which is worth $72.3 million in that time frame and will be a surplus value of $37.6 million.
In short: he's under paid and under valued. Even if we start him at 4 WAR next year rather than 4.4, you get the following value:
 There's $30.4 million in surplus value.
Basically, Curtis Granderson's surplus value to the Detroit Tigers is too great to be traded. Here's a table of research done by Victor Wang.
To get fair value for Curtis Granderson in the three projections we would need to get back:
First projection of $79.1 million: 2 top-10 hitting prospects (as ranked by Baseball America; $73 million in value) and one Grade-B pitcher (graded by John Sickels; $7.3 million). Total package value of $80.3 million.
Second projection of $72.3 million: 2 top-10 hitting prospects ($73 million in value).
Third projection of $65.1 million: 1 top-10 hitting prospect ($36.5 million), 1 top-10 pitching prospect ($15.2 million) and a Grade-B pitcher ($7.3 million), one grade-B hitter ($5.5 million). Total package value of $64 million.
Here's Baseball America's top 100 prospect list from before the season if you'd care to gander at the top 10 hitting prospects or top 10 pitching prospects.
Basically, Granderson's not going anywhere. But there's no harm in fielding offers for him.
Sunday, August 23, 2009
Jarrod Washburn vs. Lucas French
So, I stood alone on the Jarrod Washburn acquisition at the trade deadline. I felt it was a latteral move at best, and I understand the whole "veteran presence" and not having a rookie's innings limits like French will have. Being very stats-based, I'm prepared to go against the grain on certain moves (like the Aubrey Huff deal, as well...). So, let's revisit it.
First off, it's pretty premature to make any comparisons. Both Lucas French and Jarrod Washburn have thrown minimal innings (22.1 for French, 25.1 for Washburn) for their new clubs, but it's worth a look.
First, the traditional surface numbers:
Jarrod Washburn:
6.04 ERA, 25.1 IP, 13 K, 6 BB, 24 H, 8 HR allowed (though 4 came in one game).
Luke French:
4.43 ERA, 22.1 IP, 15 K, 13 BB, 27 H, 3 HR allowed.
Traditional numbers are a mix. French leads in ERA, but drags behind in the K:BB ratio.
Let's move onto Fielding Independent Pitching (FIP).
Washburn:
7.21 FIP.
French:
5.33 FIP.
FIP looks at just strikeouts, walks, home runs allowed. It divides it by innings pitch and adds around a 3.2 qualifier to put it on the ERA scale. French wins this as well, mainly because of the homer's allowed. Washburn hasn't been overly good, but his 8 homers kill his FIP and that's largely due to 25% of each fly ball he's given up going for a homer thus far. That's nearly double league average.
Let's look at xFIP (from the same source as above).
Washburn:
5.17
French:
5.86
Washburn wins this because xFIP regresses the home runs allowed by a pitcher back to the league average. Luke French gets hurt here because of the walks he's allowed while not striking out a substantial amount.
However, my favorite pitching metric is currently tRA. It is essentially a better FIP number that simulates defense-independent ERA simulators. It is based on each batted ball type a pitcher gives up. If he's getting hit hard with a ton of fly balls and line drives (the two more damaging of the FB/LD/Ground Ball batted ball types), his tRA will be higher. tRA* is the regressed version of tRA and would be what xFIP is to FIP. We'll look at tRA* since regressing is better than not regressing.
Washburn:
5.01
French:
5.08
Here, it's pretty much a dead heat. To get tERA,you must divide by .92 since 92% of all runs are earned. When we do that, Washburn's tERA is 5.45 while French's is 5.52 -- again, virtual no separation. Before the trade, the tERA's for both Washburn and French were 5.86 for Washburn and 5.49 for French.
Commenter Scott pointed out that you multiply by .92 -- I don't know what i was thinking when I wrote this. So, their tERA's are 4.61 for Washburn and 4.67 for French.
StatCorner also has Wins Above Replacements, as well. Since Washburn's come over, based on a WAR sample that uses tRA, he's provided -0.3 wins above what a replacement pitcher would bring to the Tigers in the same number of innings. French has given the Mariners -0.2 wins above what a replacement level pitcher would provide given the same number of innings.
Essentially, the two have been nearly identical once you account for Washburn's bad luck with the home run ball this year.
So, then, what is the difference between the two?
Around $3.3 million dollars in salary. I'm sure you know which one is getting paid more. My opinion on the deal hasn't changed, thus far. Here's to hoping I'm proven wrong, though.
First off, it's pretty premature to make any comparisons. Both Lucas French and Jarrod Washburn have thrown minimal innings (22.1 for French, 25.1 for Washburn) for their new clubs, but it's worth a look.
First, the traditional surface numbers:
Jarrod Washburn:
6.04 ERA, 25.1 IP, 13 K, 6 BB, 24 H, 8 HR allowed (though 4 came in one game).
Luke French:
4.43 ERA, 22.1 IP, 15 K, 13 BB, 27 H, 3 HR allowed.
Traditional numbers are a mix. French leads in ERA, but drags behind in the K:BB ratio.
Let's move onto Fielding Independent Pitching (FIP).
Washburn:
7.21 FIP.
French:
5.33 FIP.
FIP looks at just strikeouts, walks, home runs allowed. It divides it by innings pitch and adds around a 3.2 qualifier to put it on the ERA scale. French wins this as well, mainly because of the homer's allowed. Washburn hasn't been overly good, but his 8 homers kill his FIP and that's largely due to 25% of each fly ball he's given up going for a homer thus far. That's nearly double league average.
Let's look at xFIP (from the same source as above).
Washburn:
5.17
French:
5.86
Washburn wins this because xFIP regresses the home runs allowed by a pitcher back to the league average. Luke French gets hurt here because of the walks he's allowed while not striking out a substantial amount.
However, my favorite pitching metric is currently tRA. It is essentially a better FIP number that simulates defense-independent ERA simulators. It is based on each batted ball type a pitcher gives up. If he's getting hit hard with a ton of fly balls and line drives (the two more damaging of the FB/LD/Ground Ball batted ball types), his tRA will be higher. tRA* is the regressed version of tRA and would be what xFIP is to FIP. We'll look at tRA* since regressing is better than not regressing.
Washburn:
5.01
French:
5.08
Here, it's pretty much a dead heat. To get tERA,
Commenter Scott pointed out that you multiply by .92 -- I don't know what i was thinking when I wrote this. So, their tERA's are 4.61 for Washburn and 4.67 for French.
StatCorner also has Wins Above Replacements, as well. Since Washburn's come over, based on a WAR sample that uses tRA, he's provided -0.3 wins above what a replacement pitcher would bring to the Tigers in the same number of innings. French has given the Mariners -0.2 wins above what a replacement level pitcher would provide given the same number of innings.
Essentially, the two have been nearly identical once you account for Washburn's bad luck with the home run ball this year.
So, then, what is the difference between the two?
Around $3.3 million dollars in salary. I'm sure you know which one is getting paid more. My opinion on the deal hasn't changed, thus far. Here's to hoping I'm proven wrong, though.
Monday, August 17, 2009
Aubrey Huff's Value (Easy Math Ahead)
We got our left-handed bat that everyone clamored for at the trade deadline, it just took a couple of weeks. It comes in the form of lefty-slugger Aubrey Huff from the Baltimore Orioles.
But, what should we expect?
Well, the ZiPS projections for the remainder of the 2009 season has him projected for a slash line of .265/.331/.439 which would be a wOBA of .334. The league average wOBA is currently sitting at .329. If we give Huff 4 plate appearances per game, he'll have about 180 PA's to do some damage. If you convert the wOBA's into runs, you get roughly 0.78 runs above the average hitter. Let's be generous and say he goes on a big tear and outplays his projection, we'll call him a +1 run above average hitter the rest of the way.
Defensively, Huff's only been a first baseman in 2009. In fact, since 2007, he's only played 48 games at the hot corner, so if he takes over for the hurting/slumping Brandon Inge, it's a gamble. However, eyeballing the numbers, he looks to be an average defender at both 1st base and 3rd base. So, we'll just go with average, or 0 runs saved/allowed defensively.
Positionally, let's just give him the biggest boost we can and say Inge can't play 3rd the rest of the way. This is how Huff would reach his peak value, so we'll roll with it. Positional adjustment over the course of 162 games for a 3rd baseman is +2.5 runs. Pro-rated to 45 games, that's 0.69 runs in his favor.
Add this up: 1 for batting, 0 for defense, 0.69 for position and we get a grand total of 1.69 runs above average. To get to replacement level, we're looking at around another 5.5 run bonus in Huff's favor, that makes him 7.19 runs above replacement -- call it 7.25 for ease. To get wins, you divide by 10 (actually 10.5, but 10 is just cleaner) and you then get 0.725 wins.
Aubrey Huff, if he plays an average 3rd base, out-performs his projections for the rest of the season at the plate would bring around 0.75 wins. Three-quarters of a win. That is $3.6 million in on-field value. He'll make about $2 million the rest of the way, which means he's got $1.6 million surplus value to the Tigers.
But, that's not where his entire value lies. He'll be a Type-A free agent this winter. Dave Dombrowski is notorious for not going to arbitration, so I'm not sure if he'll get offered arbitration or what. We'll say he does and he turns it down and Detroit picks up two draft picks in return. Victor Wang's done research that says that's around $5 million in total value.
$1.6 million in on-field surplus value + $5 million in off-field surplus value = $6.6 million total surplus value.
But, the Tigers traded away Brett Jacobson. John Sickels rated him a B- pitcher, but we'll call him a B for this example. That is worth $5.5 million. But, Jacobson's one of the 84 college relievers Detroit took in the 2008 draft, and that lowers his worth. Lets cut that in half since relievers grow on trees. So, he's got a value of $2.75 million, now.
$6.6 million in total Aubrey Huff value - $2.75 million in Brett Jacobson value = $3.85 million in total surplus value in the Detroit Tigers favor.
Now, that 0.75 Wins Above Replacement figure is an absolute peak value for Huff -- full time 3rd baseman, average defensively. He's probably more in the 0.25 to 0.5 WAR range. If he were...
0.25 WAR, that'd lower his value to $4.3 surplus value; the total deal to $1.55 million in surplus value in Detroit's favor.
0.5 WAR, that'd lower his value to $5.5 surplus value; the total deal to $2.75 million in surplus value in Detroit's favor.
So, any way you slice it, Detroit wins the trade and marginally help themselves towards winninga a division title. Any little bit helps, though I agree with Kurt when he says:
Edit: Forgot to mention that I like that we didn't give up my favorite of the college reliever 2008 draftee's: Robbie Weinhardt. I thought he was better than Ryan Perry coming out of college.
But, what should we expect?
Well, the ZiPS projections for the remainder of the 2009 season has him projected for a slash line of .265/.331/.439 which would be a wOBA of .334. The league average wOBA is currently sitting at .329. If we give Huff 4 plate appearances per game, he'll have about 180 PA's to do some damage. If you convert the wOBA's into runs, you get roughly 0.78 runs above the average hitter. Let's be generous and say he goes on a big tear and outplays his projection, we'll call him a +1 run above average hitter the rest of the way.
Defensively, Huff's only been a first baseman in 2009. In fact, since 2007, he's only played 48 games at the hot corner, so if he takes over for the hurting/slumping Brandon Inge, it's a gamble. However, eyeballing the numbers, he looks to be an average defender at both 1st base and 3rd base. So, we'll just go with average, or 0 runs saved/allowed defensively.
Positionally, let's just give him the biggest boost we can and say Inge can't play 3rd the rest of the way. This is how Huff would reach his peak value, so we'll roll with it. Positional adjustment over the course of 162 games for a 3rd baseman is +2.5 runs. Pro-rated to 45 games, that's 0.69 runs in his favor.
Add this up: 1 for batting, 0 for defense, 0.69 for position and we get a grand total of 1.69 runs above average. To get to replacement level, we're looking at around another 5.5 run bonus in Huff's favor, that makes him 7.19 runs above replacement -- call it 7.25 for ease. To get wins, you divide by 10 (actually 10.5, but 10 is just cleaner) and you then get 0.725 wins.
Aubrey Huff, if he plays an average 3rd base, out-performs his projections for the rest of the season at the plate would bring around 0.75 wins. Three-quarters of a win. That is $3.6 million in on-field value. He'll make about $2 million the rest of the way, which means he's got $1.6 million surplus value to the Tigers.
But, that's not where his entire value lies. He'll be a Type-A free agent this winter. Dave Dombrowski is notorious for not going to arbitration, so I'm not sure if he'll get offered arbitration or what. We'll say he does and he turns it down and Detroit picks up two draft picks in return. Victor Wang's done research that says that's around $5 million in total value.
$1.6 million in on-field surplus value + $5 million in off-field surplus value = $6.6 million total surplus value.
But, the Tigers traded away Brett Jacobson. John Sickels rated him a B- pitcher, but we'll call him a B for this example. That is worth $5.5 million. But, Jacobson's one of the 84 college relievers Detroit took in the 2008 draft, and that lowers his worth. Lets cut that in half since relievers grow on trees. So, he's got a value of $2.75 million, now.
$6.6 million in total Aubrey Huff value - $2.75 million in Brett Jacobson value = $3.85 million in total surplus value in the Detroit Tigers favor.
Now, that 0.75 Wins Above Replacement figure is an absolute peak value for Huff -- full time 3rd baseman, average defensively. He's probably more in the 0.25 to 0.5 WAR range. If he were...
0.25 WAR, that'd lower his value to $4.3 surplus value; the total deal to $1.55 million in surplus value in Detroit's favor.
0.5 WAR, that'd lower his value to $5.5 surplus value; the total deal to $2.75 million in surplus value in Detroit's favor.
So, any way you slice it, Detroit wins the trade and marginally help themselves towards winninga a division title. Any little bit helps, though I agree with Kurt when he says:
He brings a veteran bat and should immediately make the club better. Not by leaps and bounds mind you, but better none-the-less.We're not leaps and bounds better, but we are better.
Edit: Forgot to mention that I like that we didn't give up my favorite of the college reliever 2008 draftee's: Robbie Weinhardt. I thought he was better than Ryan Perry coming out of college.
Friday, January 9, 2009
Tigers WAR Projections
Wins Above Replacement have caught on like wildfire around the blogging community thanks to Fangraphs popularizing the method. With this in mind, and a handy spreadsheet from Sky Kalkman, I entered in the PA projections from Marcels. This put me over the recommended "outs" limit on the spreadsheet, so I adjusted various positions (with each position equaling 700 PA's), to get the outs as close as I could (wound up with ~60 more outs than the "goal" is).
The spreadsheet can be found here. What we get is a projection of 81 wins. The trickiest thing about this is getting playing time right. I was thinking of just going with a percentage breakdown. For instance, at 1st base, give Miguel Cabrera 85% of the PA's (which would be 595) and the guy who I think will be doing more of the backing up at 1st, Jeff Larish, the remaining 105 at first, but I'm just not sure if that's the route I would like to go (probably doesn't make a lot of difference). To get the wOBA for hitters, I imported the CHONE Tigers Hitters projections, and used (OBP*1.75 + SLG)/3 since I didn't find wOBA listed in the CHONE projections.
On the pitching side, like Bill, I chose to go with Fernando Rodney and Bobby Seay in the bullpen with a bunch of replacement level relievers after that. There's just too much uncertainty surrounding it.
So, right now, we're looking at a .500 ballclub until the holes get filled in in the bullpen. Adam Peterson of Twinkie Town, has put up projections for each team in the AL Central and he's got the Tigers at 87 wins this coming year -- good for 3rd behind Cleveland (92) and Minnesota (88), while clipping the Royals (81) and the White Sox (79). He did make the disclaimer that he knows more about the Twins than the rest of the division (naturally, as he's a Twins fan, just as I wouldn't know as much about the Twins situation being that I'm a Tigers fan and follow them more closely than the other AL Central foes). I like his forecast better simply because it accounts for more wins, but we differ in our results because he actually filled out the bullpen with Joel Zumaya, Aquilino Lopez, Clay Rapada and Freddy Dolsi where as I just used replacement level guys to fill it out.
Subscribe to:
Posts (Atom)

 Posts


